

Visualization of your data - Get an illustrated view on Production and Controlling
Dashboards visualize data and provide customers with a better overview of operational performance. Dashboards can be used for both production and controlling. Simply define which KPIs are to be monitored and get a clear picture of how your business performs. With Dashboards, data can be prepared, quickly retrieved and thus changes or trends can be made transparent.
Dashboards can be used in SAP Business One Standard as well as in our beas Manufacturing solution. In both cases, Dashboards give our customers a better view of their data.
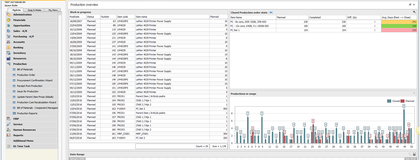
You can use dashboards to visualize the utilization, productivity, order priorities, schedule overviews or order progress in your production.
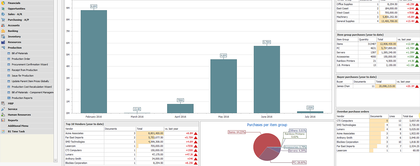
Get a quick overview of the changes in hourly rates, costs and outturn account by product group with dashboards for controlling.
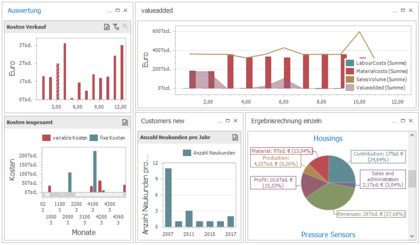
Dashboards are offering many benefits: Value creation shows the development, gaps are identified with productivity and sales and results of the product groups summarise the data. Ad-hoc evaluations supplement the view on certain main areas.
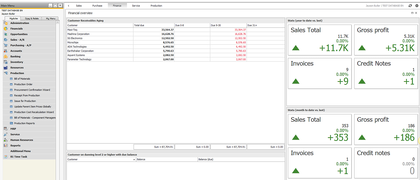
Get a quick overview of the most important KPI´s. With the B1 Dashboard we offer you a 360° view of your company.
Get a clear overview of your business performance and contact us for more information on how to get started with B1 Dashboard
Need more information?
Follow us on YouTube
We have free webinars as part of our e-learning program. Watch the recorded sessions.
Free webinar series
Join us for any of the following free live sessions. Get the most out of beas Manufacturing by joining our 30-60 min sessions with our experts. Join us...
What our customers say
The quality of a software solution can only really be judged by those who use it daily. Read more...